
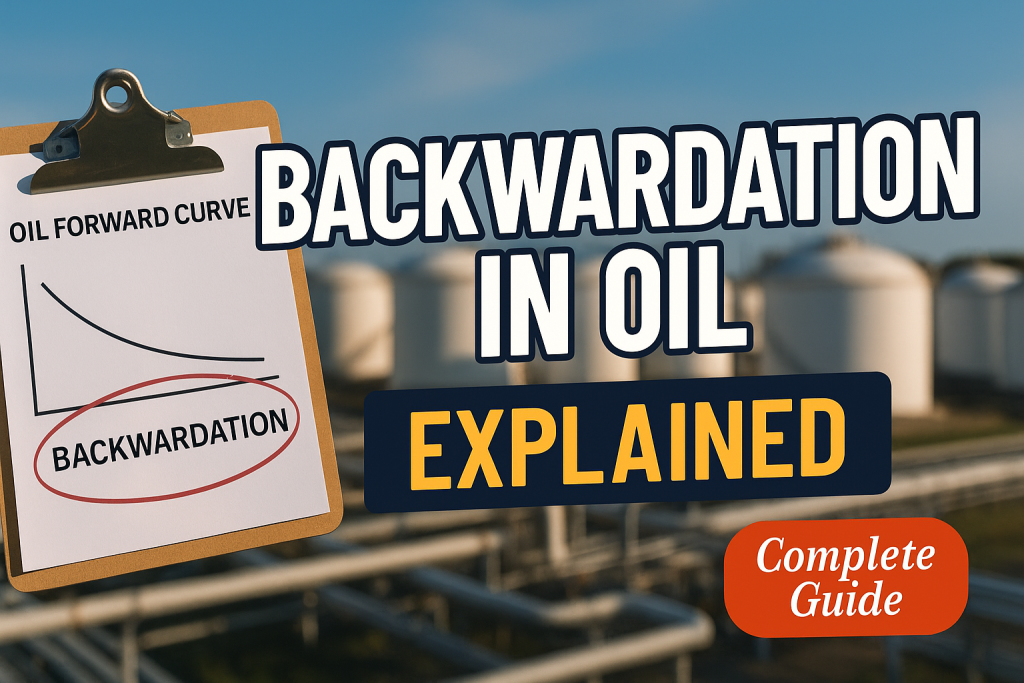
Backwardation in the oil market defined Backwardation in the oil market occurs when the spot price or near-term futures price for crude oil is higher than prices for delivery further in the future. The forward curve slopes downward rather than upward. Backwardation signals that the physical oil market is tight — buyers are paying a premium to secure crude now because supply is insufficient for immediate demand. OPEC+ production cuts, geopolitical supply disruptions, and seasonal demand surges are the most common drivers. Backwardation is generally considered a bullish market structure.
Table of Contents
- Understanding the Oil Forward Curve
- Backwardation Defined: The Curve That Slopes Down
- Contango vs Backwardation: A Side-by-Side Comparison
- What Causes Backwardation in Oil Markets
- OPEC+ Production Cuts and Backwardation
- Cushing Storage and the Physical Market Link
- What Backwardation Means for Physical Buyers and Sellers
- Roll Yield: Why Backwardation Matters for Commodity Funds
- Is WTI or Brent in Backwardation Right Now?
- Frequently Asked Questions
- Key Takeaways
Understanding the Oil Forward Curve
The oil market does not have just one price. It has dozens — one for each future delivery month, stretching years into the future.
If you look at NYMEX WTI futures prices right now, you will see a price for the contract expiring next month, a price for the month after that, one for three months from now, six months, twelve months, and so on. When you plot these prices over time, you get what traders call the forward curve or futures strip.
The shape of this curve tells you something important about current market conditions. Is the curve sloping upward (near-term cheaper than long-term)? Or sloping downward (near-term more expensive than long-term)?
In normal conditions with adequate supply, the oil forward curve slopes upward. Every barrel stored today costs money — tank rental, insurance, and the opportunity cost of the capital tied up. So crude oil for delivery in December should cost more than crude for delivery in September, just to compensate a holder for the cost of storing it for three extra months. Economists call this the cost of carry.
But markets are not always normal. When physical supply is tight — when oil is urgently needed right now — near-term prices rise above long-term prices. The curve inverts. This is backwardation.
Backwardation Defined: The Curve That Slopes Down
In backwardation, the near-term futures price is higher than the price for later delivery.
A simple example. Suppose:
- WTI for delivery next month (the “prompt” or “front-month” contract): $85/barrel
- WTI for delivery in 6 months: $82/barrel
- WTI for delivery in 12 months: $79/barrel
The curve slopes downward: $85 → $82 → $79. That is backwardation.
The market is saying: oil right now is worth more than oil in the future. The premium for immediate delivery exceeds all the costs of storage and financing.
The backwardation spread is the difference between the prompt price and a specified forward price. Traders often quote it as:
- “M1-M2 spread” (front-month minus second-month): e.g., “$85 − $83.50 = $1.50/bbl backwardation”
- “1–12 spread” (front-month minus 12-month forward): e.g., “$85 − $79 = $6/bbl backwardation”
A wide 1–12 backwardation (>$5–7/barrel) signals severe physical tightness. A narrow or near-zero 1–12 spread signals a relatively balanced market. Contango (negative number in this calculation) signals oversupply.
Contango vs Backwardation: A Side-by-Side Comparison
| Feature | Contango | Backwardation |
|---|---|---|
| Curve shape | Upward sloping (future > near) | Downward sloping (near > future) |
| Physical market signal | Oversupply or weak demand | Undersupply or strong demand |
| Storage economics | Storage is profitable (“cash-and-carry” trade) | Storage is unprofitable (opportunity cost is negative) |
| Inventory trend | Inventories building | Inventories drawing down |
| OPEC+ context | Production above target, or demand disappointing | Production cuts in force, or geopolitical supply shock |
| Roll yield for long futures position | Negative (buy expensive next month, sell cheap expiring) | Positive (sell expensive expiring, buy cheaper next month) |
| Common examples | COVID-19 demand collapse (2020); US shale surge (2015–16) | OPEC+ cuts (2022–24); Middle East supply disruption |
What Causes Backwardation in Oil Markets
Oil backwardation has multiple drivers, and they often combine to create the curve structure.
1. OPEC+ production cuts
The most powerful single driver. When OPEC+ members (primarily Saudi Arabia, UAE, Russia, Iraq) cut production, fewer barrels enter the physical market in the near term. Buyers who need crude immediately cannot find enough supply and bid the prompt price higher. Long-dated prices rise less because the market expects cuts to eventually be reversed or offset by non-OPEC production growth.
The 2022–24 period saw Brent in sustained backwardation as OPEC+ maintained production restraint through multiple rounds of output cuts. Saudi Arabia’s unilateral 1 million barrel/day voluntary cut from July 2023 pushed Brent into pronounced backwardation.
2. Geopolitical supply disruption
When a major oil-producing country experiences conflict, sanctions, or infrastructure damage, near-term supply falls suddenly. Libya’s frequent production outages (multiple civil conflict periods since 2011), Iranian sanctions (2018-19 under the US “maximum pressure” campaign), the Russian invasion of Ukraine (2022 — affecting Russian crude available to European buyers) — all created acute near-term supply shortfalls that pushed the prompt price sharply above the long-dated curve.
3. Refinery seasonal demand surges
US refinery runs peak seasonally ahead of summer driving season (April–June) and again ahead of winter heating demand (September–November). These demand surges pull on crude supply in the near term. Crude inventories draw down faster than normal, tightening the spot market and pushing prompt prices higher relative to the forward curve.
4. Physical storage constraints at Cushing, Oklahoma
For WTI specifically, storage levels at Cushing (the NYMEX delivery point) directly affect the WTI forward curve. When Cushing inventories are very low, the prompt price is bid up because any buyer taking physical delivery at Cushing has limited competition from available stored supply. When Cushing is filling up (as in April 2020), the opposite occurs: contango widens to extreme levels because nobody wants oil right now with nowhere to put it.
The EIA publishes weekly Cushing crude oil inventory data every Wednesday. A drawdown of 3–5 million barrels in one week is a significant backwardation-supporting data point. A build of the same magnitude pushes toward contango.
5. Tight global refinery utilisation
When global refinery capacity is running at high utilisation rates (above 90–92%), margins are thin for adding more crude demand. But tight refinery runs mean crude is being converted to products quickly, drawing down crude inventories faster than supply can refill them. Post-COVID demand recovery in 2021-22 coincided with high global refinery utilisation and contributed to sustained backwardation.
OPEC+ Production Cuts and Backwardation
OPEC+ — the Organisation of the Petroleum Exporting Countries plus allied producers led by Russia — is the most powerful external influence on the shape of the oil forward curve, and therefore on whether the market is in backwardation or contango.
Mechanism:
When OPEC+ announces production cuts, fewer barrels enter the physical market. The near-term crude supply tightens. Physical buyers bid up the spot price. The forward curve starts to slope downward as long-dated prices rise less than near-term prices — backwardation increases.
Key episodes:
- April 2020 emergency cut (9.7 mb/d): massive cut agreed to address COVID demand collapse. Came too late to prevent the April 2020 negative price event, but stabilised the market in May-July 2020 and began the recovery.
- November 2022 cut (2 mb/d): announced in October 2022, effective November 2022, as recession fears grew and European energy crisis was drawing natural gas substitution. Brent jumped immediately and sustained backwardation widened.
- April 2023 surprise cut (1.16 mb/d): announced outside a scheduled meeting, catching the market off guard. Brent rose $6/barrel in the session after announcement.
- Saudi Arabia voluntary cut from July 2023 (1 mb/d additional): Saudi Arabia acting unilaterally beyond OPEC+ baseline cuts. Brent backwardation widened significantly.
- 2024 extension: OPEC+ extended cuts multiple times through 2024, maintaining backwardation in a $75–90/barrel Brent market despite disappointing demand growth from China.
What the market watches:
Every OPEC+ meeting, every delegate briefing, every Saudi Energy Ministry statement is scrutinised for signals about future production. “Compliance” — whether members actually reduce production as agreed — is tracked by using tanker tracking data (Kpler, Vortexa), satellite imagery, and port flow data. Members that cheat on quotas (most commonly Iraq, Kazakhstan, and Nigeria) partially offset the official cut’s impact on the market.
Cushing Storage and the Physical Market Link
For the WTI forward curve specifically, Cushing inventory data is the most direct physical indicator of market conditions.
Cushing as price anchor:
NYMEX WTI futures are deliverable at Cushing. Any discrepancy between the futures price and what crude oil at Cushing is actually worth will be quickly exploited by traders who can move physical crude into or out of Cushing. This arbitrage keeps WTI futures anchored to Cushing physical prices.
When Cushing inventory is very low (below 30 million barrels), there is limited stored supply competing with prompt demand. Prompt buyers bid up the price, creating backwardation. When Cushing is full (above 70–75 million barrels of working capacity), there is abundant nearby supply, suppressing the prompt price and creating contango.
The EIA Wednesday release:
Every Wednesday morning at 10:30 a.m. US Eastern Time, the EIA releases the Weekly Petroleum Status Report, including crude oil inventories at Cushing and across the US broadly. This release is one of the most market-moving weekly data points in any commodity market. A large unexpected drawdown at Cushing (market expected +500k barrels, actual was −3.5 million barrels) will move WTI front-month prices $1–2/barrel within minutes of release and steepen backwardation.
What Backwardation Means for Physical Buyers and Sellers
For companies that actually buy and sell physical crude oil — refineries, crude oil producers, trading houses — backwardation has practical operational consequences.
For crude oil producers:
Producers (E&P companies, national oil companies) typically benefit from backwardation. Their production is priced at or near the prompt market price — which in backwardation is the highest price in the forward curve. They are selling the most valuable delivery date.
However, producers who want to hedge future production by selling forward futures are selling into a lower forward price in backwardation. A Texas E&P company hedging December production by selling December WTI in October (when October is at $85 and December is at $80) is locking in a price $5/barrel below the current prompt. This “negative roll” for hedgers is the cost of price certainty.
For refineries:
Refineries buy crude oil. In backwardation, the prompt crude they need to buy is the most expensive delivery. Refineries that buy spot are paying a premium versus what forward crude would cost. This can squeeze refinery margins if the premium is not offset by equally high product prices.
However, refineries that have pre-purchased forward crude (bought futures months ago) in a market that subsequently moved into backwardation have effectively locked in supply below current prompt prices — a competitive advantage.
For crude traders and storage operators:
Backwardation eliminates the “cash-and-carry” trade — buying crude spot and selling futures to lock in the carry return. With forward prices below spot, storing crude and selling it later would guarantee a loss. Storage operators see utilisation fall in backwardated markets as commercial inventory drawdowns.
Conversely, traders with physically short positions (they have sold crude they don’t yet own) benefit from backwardation — they can buy in the spot market for less than the forward price at which they committed to sell.
Roll Yield: Why Backwardation Matters for Commodity Funds
For passive commodity investors and commodity index funds holding long futures positions, backwardation creates a structural benefit called positive roll yield.
How it works:
A long futures position must be “rolled” monthly — the expiring near-term contract is sold and replaced with the next month’s contract. In backwardation:
- You sell the expiring front-month contract at $85/barrel
- You buy the next month’s contract at $83/barrel
- You received $85 and paid $83 — you “earned” $2/barrel in the roll
This positive roll yield accumulates over time. A commodity fund holding WTI in a $6/barrel 1–12 backwardation earns approximately $0.50/barrel per month in roll yield — a meaningful return independent of any price movement in the underlying spot price.
This is the opposite of contango, where every roll costs money (buy the expensive next month, sell the cheap expiring month — constant negative carry).
In practice, commodity fund performance is a combination of:
- Spot return: how much the spot price moved
- Roll yield: positive in backwardation, negative in contango
- Collateral yield: return on the cash held as margin (typically treasury bills)
For oil specifically, the roll yield during the 2022 backwardation period was significantly positive, boosting commodity fund returns above what spot price movements alone would have generated.
Is WTI or Brent in Backwardation Right Now?
As of mid-2026, the oil market has been navigating a complex environment of competing forces.
Supply factors supporting backwardation:
- OPEC+ has maintained production restraint through 2024-25, with Saudi Arabia maintaining voluntary additional cuts
- US production growth has plateaued as Permian Basin productivity improvements moderate
- Geopolitical risk premium from Middle East tensions (Red Sea disruptions affected tanker routing in 2024)
Demand factors creating uncertainty:
- Chinese demand growth has been slower than expected post-COVID recovery projections
- Global economic growth concerns (higher interest rates 2023-25 dampened industrial activity)
- Energy transition (EV adoption) beginning to modestly reduce long-term demand projections
The resulting structure:
In this environment, Brent and WTI have alternated between mild backwardation and near-flat forward curves. When OPEC+ reaffirms cuts or geopolitical events tighten near-term supply, the curve moves into backwardation. When Chinese demand data disappoints or OPEC+ members signal production increase intentions, the curve flattens or moves toward slight contango.
To check the current oil market structure, look at the M1-M2 spread (front-month minus second-month) for NYMEX WTI (CL) or ICE Brent (B) on any financial data platform. A positive number means backwardation; a negative number means contango.
Frequently Asked Questions
Is backwardation bullish or bearish for oil prices?
Backwardation is generally considered a bullish structural signal. It indicates that physical oil is in short supply relative to immediate demand — a condition that typically supports prices or suggests prices may rise further if demand continues to outpace supply. However, backwardation can also exist at the same time that prices are falling — if OPEC+ cuts cause near-term supply to be tighter than long-term supply expectations. The structure tells you about relative scarcity between time periods, not about absolute price direction.
Can backwardation persist for years?
Yes. From roughly 2004 to 2014, Brent crude spent extended periods in backwardation as rising Asian demand repeatedly outpaced supply additions. Saudi Arabia’s decision to act as “swing producer” (adjusting output to keep markets balanced) helped maintain backwardation during that period. More recently, the 2021-22 post-COVID recovery saw sustained backwardation as demand rebounded faster than supply. With OPEC+ restraint extending through 2024, backwardation persisted for extended periods.
Does backwardation mean oil prices will fall?
Not necessarily. Backwardation means that the market currently expects future prices to be lower than current prices — which could reflect expectations that supply will increase, demand will moderate, or the current supply crunch will ease. But expectations can be wrong. If the supply constraint persists or deepens, future prices may rise toward current spot rather than spot falling toward future prices. Backwardation is a market expectation, not a guaranteed outcome.
How does backwardation affect airlines and their fuel hedging?
Airlines hedge jet fuel costs to manage cash flow and cost predictability. When jet fuel and crude oil are in backwardation, an airline hedging by buying futures for future delivery is buying at a discount to current prompt prices — which seems advantageous but means they are locking in prices below what the market currently charges for immediate delivery. If the market moves from backwardation to contango (forward prices rise relative to spot), the airline’s forward hedge becomes less attractive relative to buying spot. Airlines manage this by hedging across multiple future months with varying hedge ratios rather than committing fully to one time period.
What is the “timespread” and why do traders watch it?
The timespread (or calendar spread) is the price difference between two different delivery months for the same commodity. For WTI, the M1-M2 spread (front-month minus second-month) and the 6-month or 12-month spread (front-month minus 6 or 12 months forward) are the most watched. Timespreads are traded as their own instruments — a trader can buy the WTI M1-M2 spread, betting that backwardation will widen, without taking a directional bet on absolute price levels. Timespreads are often more directly responsive to physical supply changes than outright futures prices, which also reflect macroeconomic and currency factors.
How does Cushing inventory data specifically create backwardation?
When Cushing inventory draws down significantly (because demand for WTI crude at Cushing — from Midcontinent refineries and pipelines — exceeds supply flowing in), the prompt WTI price is bid up by buyers competing for available barrels. Because Cushing inventory is directly visible through EIA data and physically verifiable, the market responds immediately to large draws. The low inventory level removes the option to run down stored supply to meet demand — buyers must buy prompt instead, bidding up the near-term price relative to the forward.
Key Takeaways
- Backwardation in the oil market means the spot or near-term futures price is higher than longer-dated futures prices — the forward curve slopes downward, the opposite of the normal contango structure.
- Backwardation signals physical market tightness: buyers are paying a premium to secure crude oil now because near-term supply is insufficient for near-term demand.
- The main causes of oil backwardation are: OPEC+ production cuts (reducing near-term supply); geopolitical supply disruptions; seasonal demand surges (summer driving, winter heating); and low crude inventory levels at Cushing, Oklahoma (the WTI delivery point).
- The M1-M2 spread (front-month minus second-month WTI or Brent price) and the 1–12 spread (front-month minus 12-month forward) are the standard metrics for measuring backwardation intensity. A wide 1–12 spread above $5–7/barrel indicates severe market tightness.
- OPEC+ production decisions are the most powerful external driver of oil forward curve structure. Production cut announcements steepen backwardation; production increase signals flatten the curve toward contango.
- Weekly EIA crude oil inventory data (Cushing stocks specifically) is the most market-sensitive regular indicator of near-term WTI physical market tightness — large draws push toward backwardation; large builds push toward contango.
- For commodity funds holding long oil futures, backwardation generates positive roll yield (sell expensive near-month, buy cheaper next month) — a structural performance benefit absent in contango markets.
- For physical buyers (refineries, crude oil traders), backwardation raises the cost of prompt purchases relative to forward-contracted supply, making forward purchasing agreements more valuable when the market is expected to remain tight.
Related Reading
To deepen your understanding of the topics covered in this article, explore these related guides: when the market flips into the opposite structure, how crude oil contracts are traded on exchanges and the shape of the futures curve over time.

Understanding Commodities is a free, neutral education site explaining how global commodity markets work — for importers, exporters, agribusinesses, and manufacturers. Every guide is written from the business perspective, not the trading floor. No broker. No agenda. No jargon.
Continue Reading
More guides from Understanding Commodities
Natural Gas Liquids (NGLs): What They Are, How They're Priced, and Why They Matter
Natural gas liquids (NGLs) explained: what ethane, propane, butane and pentane are, how they're priced at Mont Belvieu, and why...
Read article →
The Gold-Silver Ratio Explained: Definition, History and How Investors Use It
The gold-silver ratio explained: definition with worked example, historical range from 16:1 to 100+:1, why gold is monetary and silver...
Read article →
EU ETS Explained: How the Emissions Trading System Works
EU ETS explained: how Europe's carbon trading system works, EUA price history, EU ETS 2 for buildings and transport, CBAM,...
Read article →