
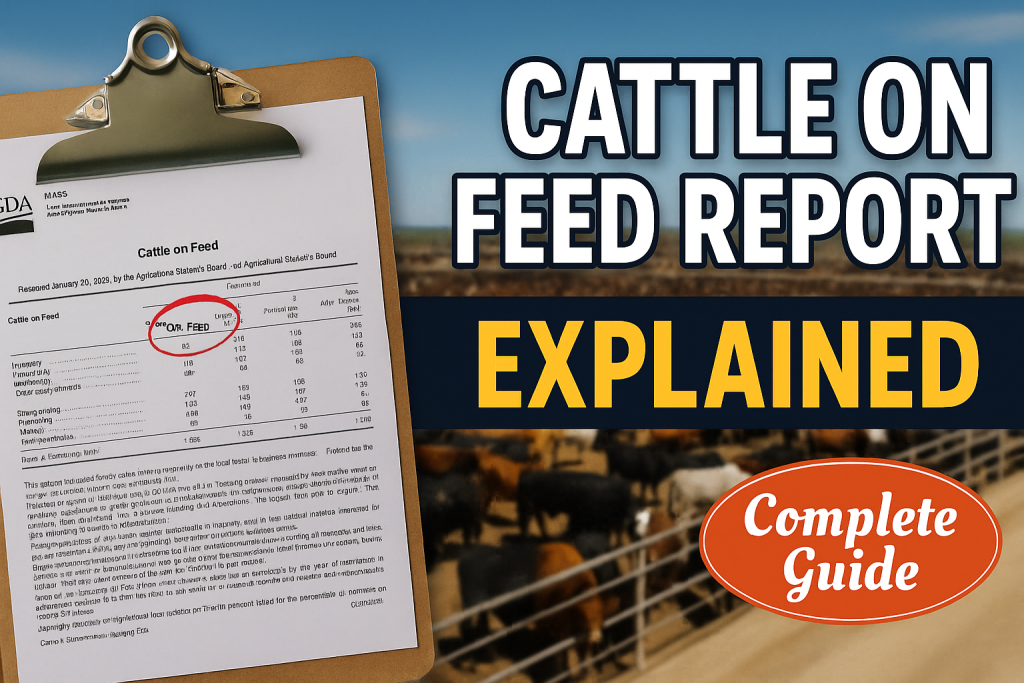
USDA Cattle on Feed report defined The USDA Cattle on Feed report is a monthly statistical survey published by the USDA’s National Agricultural Statistics Service (NASS) that tracks the number of cattle and calves in US feedlots with a capacity of 1,000 head or more. It covers four key metrics: total cattle on feed, placements into feedlots, marketings out to slaughter, and other disappearances. Released on the third Friday of each month, it is one of the most market-moving reports in the livestock commodity sector, with the potential to shift Live Cattle (LE) and Feeder Cattle (GF) futures prices significantly on release day.
Table of Contents
- What Is a Feedlot and Why Does It Matter?
- The Report: Who Publishes It and When
- The Four Key Metrics Explained
- Which Feedlots Are Included — and Which Aren’t
- How the Report Moves Cattle Futures Prices
- Placements: The Most Market-Sensitive Number
- How to Read the Report: Year-over-Year and vs. Estimates
- Frequently Asked Questions
- Key Takeaways
What Is a Feedlot and Why Does It Matter?
To understand the Cattle on Feed report, start with what a feedlot is and where it sits in the beef supply chain.
A beef animal follows a production cycle from birth to slaughter that runs approximately 18–24 months. The final phase — typically the last 3–6 months — is spent in a feedlot (also called a confined animal feeding operation, or CAFO). In a feedlot, cattle are fed a high-energy, grain-based diet (primarily corn and distiller’s grain) to promote rapid weight gain. An animal entering a feedlot typically weighs 600–900 lbs; it exits — for slaughter — at 1,200–1,500 lbs.
The feedlot phase is where the grain market and the beef market intersect directly. Corn prices affect feedlot profitability; corn price spikes squeeze margins or reduce placements. This connection between grain markets and livestock markets is one reason commodity traders watch both sectors simultaneously.
The Cattle on Feed report gives a monthly snapshot of exactly how many cattle are in this final feeding phase — and how many entered, exited, or otherwise left the system in the previous month. That inventory figure is the direct upstream indicator for beef supply 3–6 months into the future.
The Report: Who Publishes It and When
Publisher: USDA National Agricultural Statistics Service (NASS)
Frequency: Monthly
Release timing: Third Friday of each month, at 3:00 PM Eastern Time (after futures markets have closed for the regular trading session)
The 3:00 PM release time is deliberate — it follows the close of the regular CME livestock futures trading session, giving market participants time to digest the data before the next trading day opens. Electronic trading continues after the release, so price reactions begin almost immediately.
Coverage area: The report covers 13 states that account for approximately 85% of US fed cattle production: Arizona, California, Colorado, Idaho, Iowa, Kansas, Nebraska, Oklahoma, South Dakota, Texas, Utah, Washington, and Wyoming. Kansas, Nebraska, Texas, and Iowa dominate; these four states alone account for the majority of large commercial feedlot capacity.
Data collection: NASS surveys feedlot operators directly. The survey covers operators of feedlots with 1,000 head or more capacity — not all feedlots in the US, but all of the large commercial operations that drive the commodity market.
The Four Key Metrics Explained
The Cattle on Feed report publishes four figures for the reference month. Understanding each one is essential for interpreting the report’s market implications.
1. Total Cattle on Feed
The total number of cattle and calves in feedlots of 1,000+ head capacity on the first of the survey month. This is a stock figure — a snapshot of inventory.
This number is compared to the same date one year ago (year-over-year percentage change). When Total on Feed is above year-ago levels, it signals that more beef supply is working its way through the production pipeline — which is typically bearish for near-term cattle prices.
A typical reading might be: “Total cattle on feed as of December 1 was 11.5 million head, up 3% from a year earlier.”
2. Placements
The number of cattle placed into feedlots during the survey month. This is a flow figure — it tells you how much new inventory entered the system.
Placements are the most forward-looking metric in the report. Cattle placed in December will be marketed (sent to slaughter) in approximately 3–6 months — around March through June. So the December placements figure gives the market a signal about beef supply in spring.
Placements are also reported in weight classes (less than 600 lbs, 600–699 lbs, 700–799 lbs, 800+ lbs), which gives further granularity about when those cattle will be ready for market. Lighter animals take longer to reach market weight; heavier animals are closer to ready.
3. Marketings
The number of cattle shipped out of feedlots for slaughter during the survey month. This is also a flow figure.
Marketings tell you how much of the feedlot inventory has been converted to beef supply in the recent month. High marketings reduce the on-feed inventory; low marketings (often during holiday periods when packing plants run reduced schedules) leave more cattle on feed.
4. Other Disappearances
Cattle that left feedlots for reasons other than slaughter — deaths, illness removals, sales for purposes other than slaughter. This is typically a small number (well under 1% of the on-feed total) but is tracked for completeness of the inventory balance.
The Inventory Equation
The four metrics relate to each other mathematically:
On Feed (this month) = On Feed (last month) + Placements − Marketings − Other Disappearances
If you know three of the four numbers, you can solve for the fourth. Market analysts use this relationship to cross-check published figures and to reconcile the monthly report with weekly slaughter data.
Which Feedlots Are Included — and Which Aren’t
The Cattle on Feed report covers feedlots with 1,000 head or more of one-time capacity. This threshold is a deliberate choice: it captures the commercial feedlot sector that drives the commodity market while excluding the very large number of small backgrounding operations and stocker cattle operations.
In the US, approximately 2,500–3,000 feedlots meet the 1,000-head threshold. There are tens of thousands of smaller operations, but they hold a much smaller share of total fed cattle inventory.
What the report does NOT cover:
- Feedlots with fewer than 1,000 head capacity
- Stocker cattle operations (where cattle graze pasture and grow at lower intensity before entering a feedlot)
- Backgrounding operations
- Cattle in non-surveyed states
The 13-state coverage area and 1,000-head threshold mean the report captures approximately 85% of the US commercially fed cattle supply. The USDA supplements this with annual surveys of smaller feedlots, but the monthly report is the large commercial sector.
How the Report Moves Cattle Futures Prices
The Cattle on Feed report is one of the more consistently market-moving USDA reports in livestock commodities. Here’s why and how.
The Price Transmission Mechanism
Live Cattle futures (CME ticker: LE) price the finished, fed animal at its approximate market weight before slaughter. Feeder Cattle futures (CME ticker: GF) price the lighter, grazing-phase animal before it enters the feedlot.
The Cattle on Feed report affects both:
- Live Cattle (LE): If on-feed numbers are large and placements are high, more beef supply is coming to market in 3–6 months. All else equal, that’s bearish for deferred Live Cattle contracts.
- Feeder Cattle (GF): High placements reduce the current supply of feeder-weight cattle available in the immediate market (they’re now in feedlots). But high placements also signal strong demand from feedlot operators, which is bullish for the cash feeder market.
The Direction of Price Reaction
The market reacts to surprise relative to pre-report expectations, not the absolute number:
- Placements above analyst estimates → typically bearish for deferred Live Cattle (more supply coming), and can be mixed for Feeder Cattle
- Marketings above estimates → near-term bearish signal (more beef supply recently), which can push nearby Live Cattle contracts lower
- Total on Feed below year-ago → bullish for cattle prices (tighter pipeline = less future supply)
Electronic trading after the 3:00 PM release frequently shows 1–3% price moves on a report that materially surprises analyst estimates in either direction.
Placements: The Most Market-Sensitive Number
Of the four metrics, placements attract the most market attention — and for good reason.
Placements are the only metric that gives direct insight into future supply rather than the current state or recent history. They’re the pipeline input figure. Total on Feed is a stock indicator — it tells you where you are. Placements is a flow indicator — it tells you where you’re going.
Here’s what makes placements especially informative:
Seasonal patterns: Placements are heavily influenced by the seasonal availability of pasture-raised cattle and by producer decisions about when to sell calves. Fall placements (September through November) are typically the highest of the year as spring-born calves are weaned and placed into feedlots. Summer placements are lower.
Weight class breakdowns: Cattle placed at lighter weights (under 600 lbs) will not reach market weight for 5–7 months. Cattle placed at heavier weights (800+ lbs) may be marketable in as few as 2–3 months. The weight distribution within the placements figure tells analysts not just how many animals are coming but approximately when.
Corn price relationship: When corn prices are high (increasing feedlot costs), placements tend to soften — feedlot operators are less eager to purchase and feed expensive animals. Conversely, when corn prices are low, placements can accelerate as feeding margins improve.
Drought effects: Severe drought forces ranchers to reduce herd sizes by selling cattle early — which can produce a temporary placements surge, followed by a prolonged period of below-average placements as the breeding herd contracts. The 2011–2013 drought cycle and the 2022 drought both showed this pattern clearly.
How to Read the Report: Year-over-Year and vs. Estimates
The USDA publishes the Cattle on Feed report as a straightforward table with the current-month figures and year-ago comparisons. Here’s how to extract market-relevant information.
Step 1: Check the Pre-Report Trade Estimates
In the week before release, analysts from futures brokerage firms, agricultural banks, and commodity research services publish their expectations for the three flow metrics (placements, marketings, other disappearances — since Total on Feed is derived). These estimates are compiled and published by news services (Reuters, Bloomberg) as a range and average.
The market has typically priced in the analyst average expectation by release time. What matters is the surprise — how much the actual figure differs from the estimate average.
Step 2: Look at Year-over-Year Percentage Changes
The report presents all four metrics with both the absolute number and the percentage change from the same month a year earlier. This year-over-year (YoY) comparison removes seasonal patterns and gives you the trend signal.
Interpreting YoY changes for each metric:
| Metric | Above Year-Ago | Below Year-Ago |
|---|---|---|
| Total on Feed | Bearish (more cattle in pipeline) | Bullish (tighter pipeline) |
| Placements | Bearish for deferred LE contracts | Bullish for deferred LE contracts |
| Marketings | Near-term bearish (more supply hitting packers) | Near-term bullish |
Step 3: Look at the Weight Class Breakdown for Placements
The heavier the placement weight distribution, the sooner those animals will be ready for slaughter. If placements are up 10% YoY but heavily weighted toward 800+ lb animals, the near-term supply impact is more immediate than if those placements were mostly under 600 lb animals.
Step 4: Cross-Reference with Weekly USDA Slaughter Data
The USDA publishes weekly cattle slaughter numbers every Friday. These can be used to track whether the Cattle on Feed report’s marketings figure is consistent with known slaughter volumes — useful for cross-checking data accuracy and understanding week-to-week variation within the month.
Frequently Asked Questions
How does a drought affect the Cattle on Feed report?
Drought forces ranchers to reduce herd sizes because grass pastures fail. They sell cattle earlier than planned — which appears in the Cattle on Feed report as a temporary surge in placements. After the surge, placements drop below average as the breeding herd is smaller, and this tighter future supply eventually becomes bullish for cattle prices 12–24 months later. The 2022 Western US drought produced exactly this pattern.
Why is the report released after markets close?
The USDA specifically schedules major agricultural reports at times that prevent information asymmetry during live trading. Releasing at 3:00 PM Eastern — after the CME livestock session closes — gives all market participants equal access to digest the numbers before electronic trading and the next morning’s open. This protects against front-running based on leaked report data.
Can I access the Cattle on Feed report for free?
Yes. The USDA NASS publishes the full report at no cost at usda.gov/nass. Historical data is freely available. The report is released simultaneously to all parties — there is no advance access for commercial subscribers.
What’s the difference between “fed cattle” and “feeder cattle”?
“Fed cattle” (also called “finished cattle” or “fat cattle”) refers to animals that have completed the feedlot phase and are at market weight (1,200–1,500 lbs), ready for slaughter. “Feeder cattle” refers to lighter animals (600–900 lbs) that haven’t yet entered or completed the feedlot phase. The Cattle on Feed report tracks cattle in the feeding phase — transitioning from feeder weight to fat cattle weight.
What happens to beef prices if placements are consistently above year-ago for several months?
Large placements today mean more cattle ready for slaughter in 3–6 months. If multiple months of above-average placements stack up, the market anticipates a prolonged period of elevated beef supplies, which is bearish for fat cattle prices and can pressure packer margins. This is a known multi-month cycle in cattle markets.
Does the Cattle on Feed report cover grass-fed beef production?
No. Grass-fed beef animals typically never enter a feedlot and are therefore excluded from the Cattle on Feed report. The grass-fed sector is a small percentage of total US beef production (under 5%), does not trade on futures exchanges as a distinct product, and is not captured by the major USDA livestock statistical programs.
Key Takeaways
- The USDA Cattle on Feed report is published monthly by USDA NASS, released at 3:00 PM Eastern on the third Friday of each month, covering feedlots of 1,000+ head in 13 key states.
- The four metrics are: Total on Feed (stock), Placements (inflow), Marketings (outflow), and Other Disappearances — they balance in an inventory equation.
- Placements is the most market-sensitive metric because it signals future beef supply 3–6 months ahead, when those animals will reach slaughter weight.
- The report moves Live Cattle (LE) and Feeder Cattle (GF) futures based on how actual figures compare to pre-report analyst estimates — the surprise matters more than the absolute number.
- Above-year-ago placements are typically bearish for deferred Live Cattle futures because they signal more supply coming; below-year-ago Total on Feed is bullish.
- Drought forces early placements (a short-term bearish supply signal) followed by a prolonged period of tight cattle supplies — a bullish cycle that plays out 12–24 months later.
Related Reading
To deepen your understanding of the topics covered in this article, explore these related guides: the two CME contracts that track animals at different production stages and the protein supplement that complements grain in feedlot rations.

Understanding Commodities is a free, neutral education site explaining how global commodity markets work — for importers, exporters, agribusinesses, and manufacturers. Every guide is written from the business perspective, not the trading floor. No broker. No agenda. No jargon.
Continue Reading
More guides from Understanding Commodities

The US Corn Supply Chain: From Grain Elevator to Global Market
The US corn supply chain explained: from farm and grain elevator to export terminals, end-use breakdown, river barge logistics, and...
Read article →
Oil Futures Explained: What They Are, How WTI and Brent Work, and What Drives the Price
Oil futures explained: what WTI and Brent contracts are, how the NYMEX CL contract works, why oil went negative in...
Read article →
What Is the Steel Scrap Market? How It Works, Key Grades and Price Drivers
What is the steel scrap market? Learn how scrap grades, EAF steelmaking, and price drivers like Turkey's import demand work...
Read article →